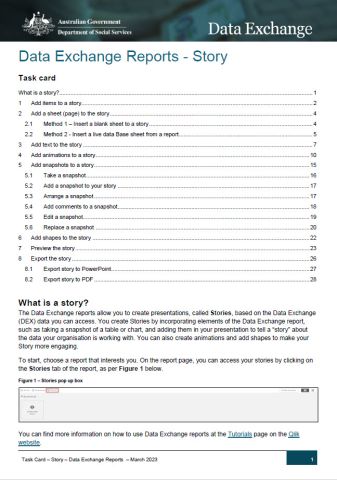
The Data Exchange reports allow you to create presentations, called Stories, based on the Data Exchange (DEX) data you can access. You create Stories by incorporating elements of the Data Exchange report, such as taking a snapshot of a table or chart, and adding them in your presentation to tell a “story” about the data your organisation is working with. You can also create animations and add shapes to make your Story more engaging.
How can we help you?
Training Resources
The following training resources provide guidance to new users about the Data Exchange web-based portal.
Technical Support
The following resources provide technical guidance for the Data Exchange.
Data Exchange helpdesk
For general enquiries or assistance with developer and IT support.
- dssdataexchange.helpdesk@dss.gov.au
- 1800 020 283 9:00am to 5:00pm, Mon to Fri
